


INTRODUCTION
Logistics service workers face elevated injury rates of 5.5 per 100 full-time equivalent workers compared to 2.7 industry average, with musculoskeletal disorders comprising 30% of all injuries.1,2 These workers traverse approximately 8 kilometers per shift while handling diverse package loads, creating substantial demands on postural control systems.3 Ankle-related injuries account for 23% of logistics worker injuries, with an average of 20 lost workdays per incident, emphasizing the critical need for effective risk assessment strategies.4
Foot posture assessment has traditionally relied on binary classifications of pronated versus supinated feet, yet this approach oversimplifies the complex biomechanical relationships between different anatomical segments.3,5,6 Rearfoot alignment, assessed through resting calcaneal stance position (RCSP), reflects weight distribution patterns and influences frontal plane stability through subtalar joint control.7,8 Conversely, midfoot function, evaluated through navicular drop measurements, indicates medial longitudinal arch mobility and contributes to shock absorption during weight-bearing activities.9 Recent evidence demonstrates that these anatomical regions contribute differentially to postural control, with rearfoot valgus ≥7 degrees impairing dynamic platform stability while midfoot mobility affects proprioceptive feedback mechanisms.7,10
The Y-Balance Test has emerged as a validated dynamic balance assessment tool for occupational populations. Studies in logistics workers have established population-specific cut-off values ranging from 85.99% to 96.98% of limb length for composite scores, with posteromedial reach direction demonstrating strongest discriminative ability for identifying balance deficits.11 Construction worker research has similarly demonstrated that age, navicular drop, and leg length collectively predict 21-23% of dynamic balance variance, with foot posture characteristics serving as significant biomechanical determinants.12
Traditional analytical approaches using predetermined foot type categories may fail to capture the multidimensional nature of foot posture characteristics. Unsupervised machine learning clustering techniques offer the potential to identify naturally occurring phenotypic patterns within complex datasets without imposing preconceived classifications.13 Recent applications of k-means and hierarchical clustering to biomechanical data have successfully identified distinct movement patterns that correlate with clinical outcomes and functional performance measures.13,14 These data-driven approaches may reveal foot posture combinations that extend beyond traditional pronated-supinated classifications and demonstrate varying degrees of postural control vulnerability.
The integration of demographic factors including age, body mass index, and work duration with both rearfoot and midfoot characteristics through clustering analysis may provide enhanced understanding of which specific foot posture patterns are most detrimental to dynamic balance performance. Given the substantial occupational health burden and growth in the logistics sector, identifying high-risk foot posture phenotypes could inform targeted intervention strategies and improve workplace injury prevention programs.
The purpose of this study was to apply unsupervised machine learning clustering to identify distinct foot posture phenotypes among logistics service workers based on age, body mass index, work duration, navicular drop, and RCSP, and to compare dynamic balance performance between identified clusters using the Y-Balance Test. It was hypothesized that distinct foot posture-based clusters would emerge that demonstrate significant differences in dynamic balance performance.
METHODS
A total of 236 logistics service workers were initially recruited from a logistics company healthcare center between August 2021 and March 2022. Of these, 31 participants were excluded due to missing data and 93 were excluded for recent ankle sprains or lower extremity injuries within the past month, resulting in a final sample of 112 participants. The study received ethical approval from the Institutional Review Board at Yonsei University Mirae campus (IRB no. 1041849-202301-BM-016-01), with informed consent waived due to the retrospective nature of the data analysis.
Inclusion criteria were: (1) individuals over 18 years of age, (2) ability to perform the Y-Balance Test without pain or discomfort, and (3) minimum of 6-month work experience in logistics service (Kim et al., 2025). Exclusion criteria included: (1) history of lower extremity surgery within the past 6 months, (2) diagnosed ankle osteoarthritis, (3) previous ankle surgery involving intra-articular fixation, (4) acute musculoskeletal injury or pain in the lower extremities within the past 3 months, (5) history of vestibular disorders or balance impairments, (6) neurological conditions affecting balance, and (7) uncorrected visual impairments.15
The navicular drop test was conducted following standardized procedures to assess medial longitudinal arch mobility and foot posture.16 Participants were initially seated with feet flat on the floor and knees flexed at 90 degrees. The most prominent point of the navicular tuberosity was identified and marked while maintaining the subtalar joint in neutral position. The height of the navicular tuberosity from the floor was measured using a rigid ruler placed perpendicular to the ground. Participants were then asked to stand in a relaxed bilateral stance position with equal weight distribution, and the navicular height was measured again. The navicular drop value was calculated as the difference between seated and standing measurements, recorded in millimeters, with excellent intra-rater reliability previously demonstrated (ICC = 0.88-0.97).16
RCSP was measured to assess rearfoot alignment following validated protocols for foot posture assessment.3,8,17 Participants stood in a relaxed bilateral stance on a 20-cm high platform with feet shoulder-width apart. A bisecting line was drawn on the skin over the posterior aspect of the calcaneus using anatomical landmarks. The angle between this bisecting line and a vertical reference line was measured using a standard goniometer in the frontal plane. Measurements were recorded in degrees, with positive values indicating valgus (eversion) and negative values indicating varus (inversion) positioning.
The Y-Balance Test was performed using a standardized testing kit following established protocols to assess dynamic balance.18 Participants stood on their dominant leg at the center of the testing platform with hands placed on the iliac crests. The non-dominant leg was used to push the reach indicator as far as possible in three directions: anterior, posteromedial, and posterolateral. Six practice trials were performed in each direction before data collection to minimize learning effects.19 Three successful trials were recorded for each direction, with the maximum reach distance measured in centimeters at the point where the most distal part of the reaching foot touched the measuring tape. Reach distances were normalized to leg length (measured from anterior superior iliac spine to medial malleolus) and expressed as percentages. The Y-Balance Test has demonstrated excellent reliability in adult populations with intra-rater reliability (ICC = 0.85-0.91) and good validity for dynamic balance assessment.18-20
Five variables were selected for clustering analysis: age, work duration, body mass index, navicular drop, and RCSP. Missing data were removed from the dataset following established machine learning preprocessing protocols. All variables were normalized to the interval [-1, 1] using min-max scaling to ensure equal contribution to the clustering algorithm regardless of measurement units or scales, for K-means clustering applications.
K-means clustering was performed to identify distinct foot posture phenotypes within the dataset using established unsupervised machine learning approaches.11,14 The optimal number of clusters was determined using silhouette score analysis, with the cluster number yielding the highest silhouette score selected for final analysis, consistent with recent biomechanical clustering applications.13,21 The K-means algorithm was configured with random initialization, 10 re-runs to ensure stability, and a maximum of 300 iterations for convergence.13,21 Cluster centroids were calculated and participants were assigned to clusters based on minimum Euclidean distance from centroids.
Descriptive statistics were calculated for all variables including means, standard deviations, and ranges. Normality of data distribution was assessed using the Kolmogorov-Smirnov test, as applied in recent foot posture research. For comparisons between three or more clusters, one-way analysis of variance (ANOVA) was performed. When significant main effects were detected (p < 0.05), Fisher’s Least Significant Difference (LSD) post-hoc testing was conducted to identify specific between-group differences. The significance level was set at α = 0.05 for all statistical tests. Statistical analyses were performed using SPSS version18.0 (IBM Corp., Armonk, NY).
RESULTS
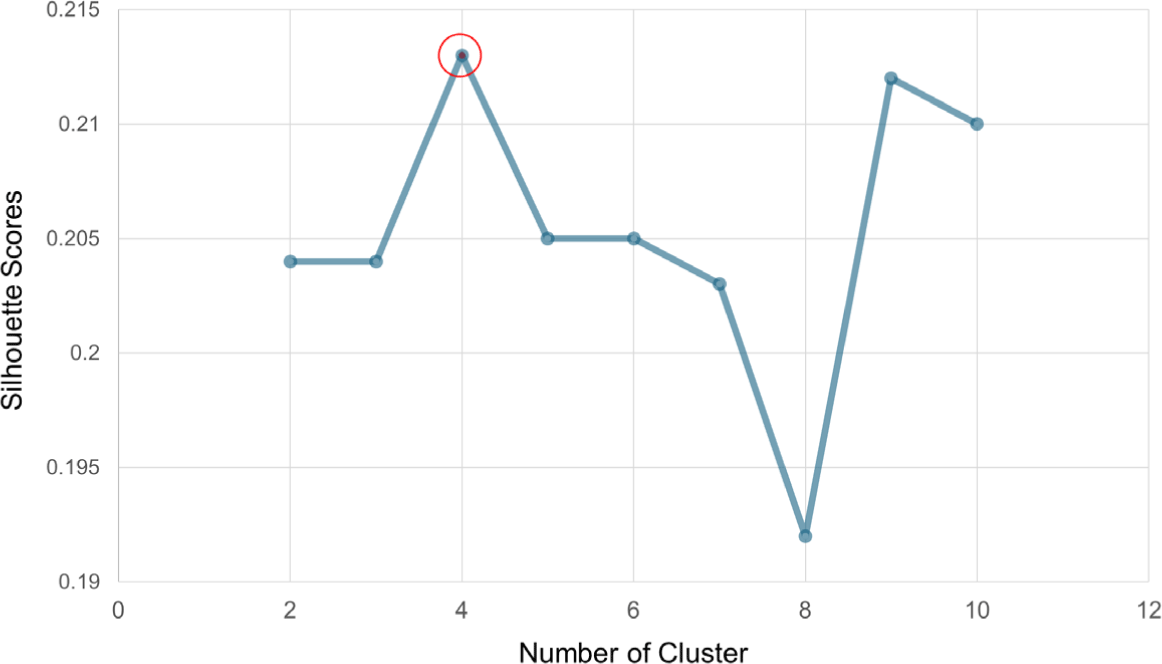
The final sample consisted of 112 logistics service workers with a mean age of 37.72 ± 9.10 years and mean BMI of 22.88 ± 3.21 kg/m2 (Table 1). The silhouette score analysis identified four as the optimal number of clusters (Figure 1), with the K-means algorithm successfully partitioning participants into distinct phenotypic groups based on age, work duration, BMI, navicular drop, and RCSP.
The clustering analysis revealed four distinct phenotypes that demonstrated significant differences across multiple variables (Table 2), with foot posture parameters showing particularly strong differentiation (navicular drop: F = 40.622, p < 0.001; RCSP: F = 29.417, p < 0.001) (Figure 2). These phenotypes represented different manifestations of foot posture abnormalities and their associated characteristics.
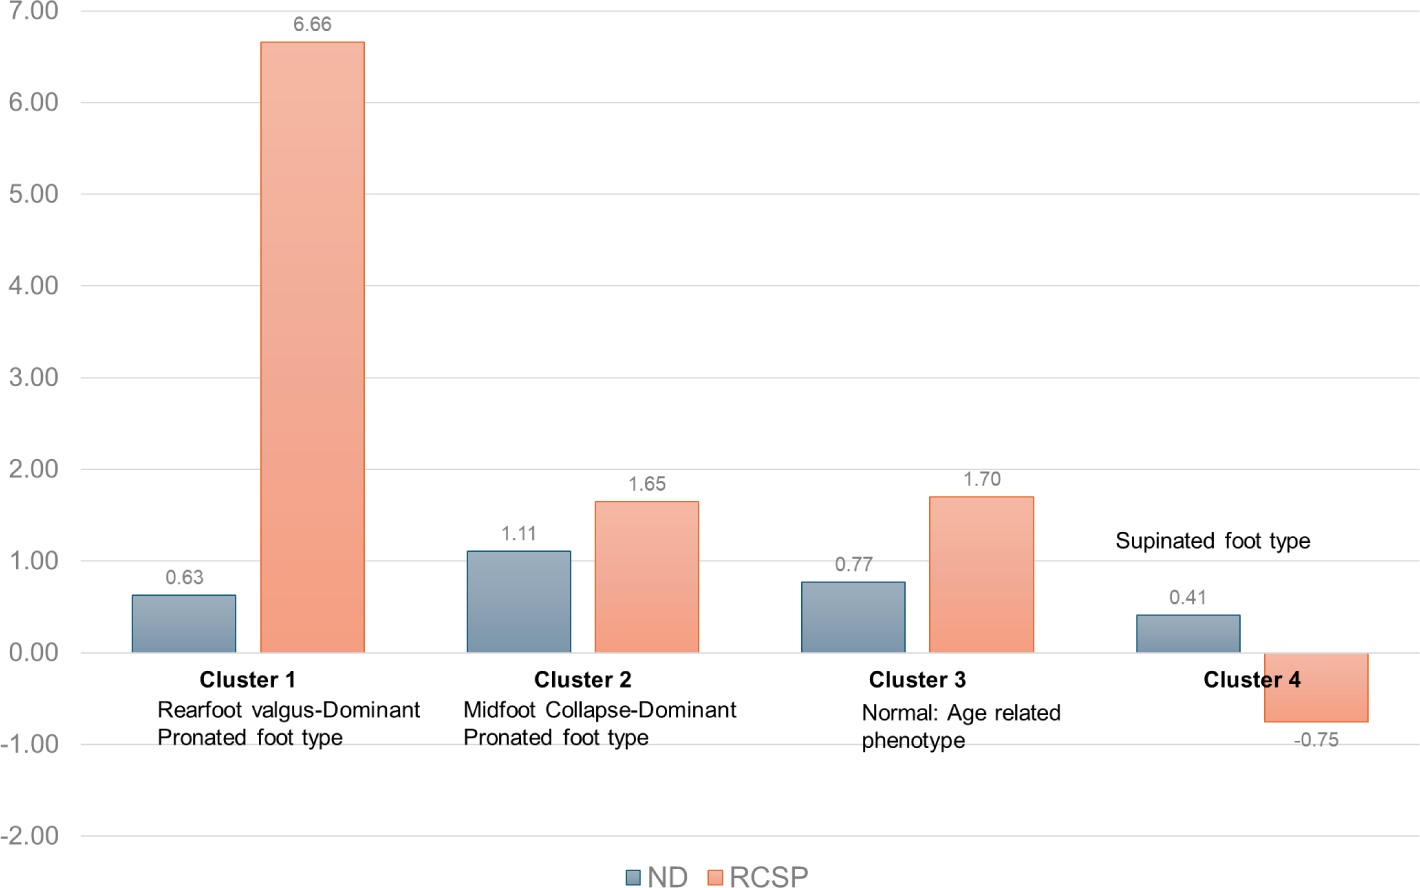
Cluster 1 (n=22) emerged as a rearfoot valgus-dominant pronated foot type, characterized by the most pronounced rearfoot valgus alignment (6.66±2.60°) combined with moderate navicular drop (0.63±0.29 cm). This phenotype was associated with higher BMI (25.18±3.32 kg/m2) and the longest work duration (663.73 ± 466.10 days), suggesting that prolonged occupational exposure and increased body weight may contribute to this rearfoot-dominant pronation pattern. In contrast, Cluster 2 (n=32) represented a midfoot collapse-dominant pronated foot type, exhibiting the highest navicular drop (1.11±0.17 cm) while maintaining relatively moderate rearfoot positioning (1.65±2.41°). Interestingly, this cluster consisted of the youngest workers (31.06±4.60 years) with the shortest work duration (316.97±201.80 days), indicating that this midfoot-predominant pattern may represent an early-onset foot posture abnormality rather than one developed through occupational wear.
The clustering also identified an unexpected age-related phenotype in Cluster 3 (n=23), which was distinguished primarily by advanced age (50.91±3.50 years) rather than specific foot posture characteristics. While this cluster showed moderate pronation features (navicular drop: 0.77±0.37 cm; rearfoot valgus: 1.70±3.57°), the predominant clustering factor was chronological age, suggesting that aging may create a distinct worker profile that transcends specific foot posture classifications. This finding contrasts with Cluster 4 (n=35), which represented a clear supinated foot type characterized by negative RCSP (–0.75±2.87°, indicating varus alignment) and the lowest navicular drop (0.41±0.22 cm), reflecting maintenance of a high medial longitudinal arch structure.
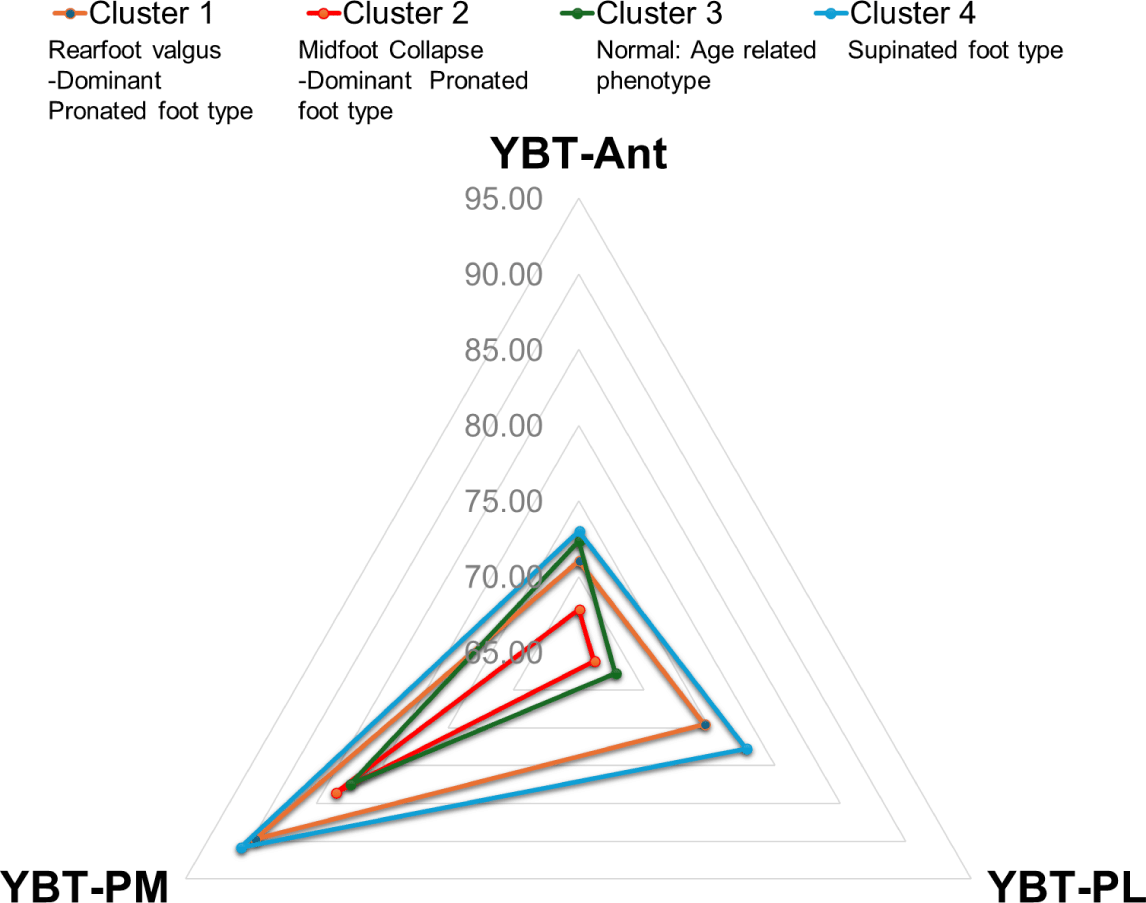
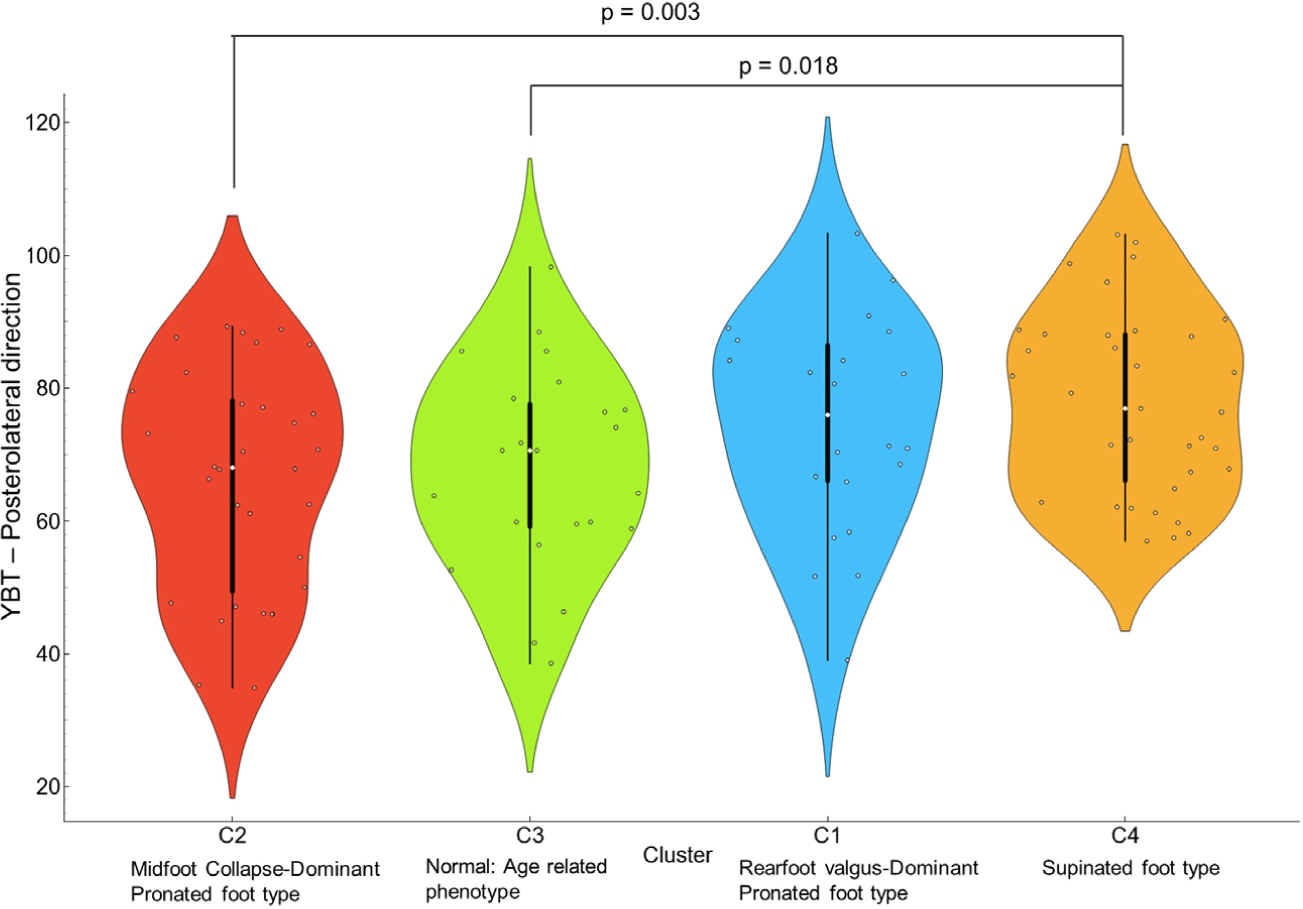
The functional implications of these distinct foot posture phenotypes became evident in dynamic balance performance, with significant differences observed in the posterolateral direction of the Y-Balance Test (F=3.900, p=0.011), while anterior and posteromedial directions showed non-significant trends (p=0.067 and p=0.062, respectively) (Figure 3). The supinated foot phenotype (Cluster 4) demonstrated superior posterolateral reach performance (77.76±13.63%), which differed significantly from both the midfoot collapse-dominant pronated type (Cluster 2: 66.18±16.37%, mean difference=11.58%, p=0.003) and the age-related phenotype (Cluster 3: 67.78±14.97%, mean difference=9.97%, p=0.018) (Table 3, Figure 4). The rearfoot valgus-dominant pronated type (Cluster 1) showed intermediate performance (74.57±15.88%), suggesting that the specific pattern of foot posture abnormality influences dynamic balance capabilities, with midfoot collapse appearing more detrimental to posterolateral stability than isolated rearfoot malalignment.
DISCUSSION
This study represents a significant advancement in foot posture classification and its relationship with dynamic balance performance in occupational settings. Our unsupervised machine learning approach offers distinct advantages over traditional foot posture classification methods such as binary pronation-supination categories or the FPI by identifying naturally occurring phenotypes without predetermined categorical frameworks. Unlike traditional methods that focus primarily on static foot posture assessment, our clustering methodology simultaneously integrates biomechanical, occupational, and demographic characteristics to reveal complex risk profiles that would not be captured by conventional binary classification systems. This data-driven approach identified unique phenotypes such as the “Midfoot Collapse” group (C2) with combined high navicular drop and RCSP values, and the “Age-Related” group (C3) where demographic factors override biomechanical factors in determining balance performance. For occupational health applications, this multi-dimensional clustering provides more nuanced risk stratification for logistics workers, enabling targeted interventions for specific subgroups rather than broad categorical approaches.
The application of unsupervised machine learning for foot posture classification yielded results that both align with and extend beyond previous research findings. Traditional approaches have typically employed binary comparisons between normal and pronated feet or utilized predetermined foot type categories based on measurements such as navicular drop or foot posture index.12,15 The current clustering analysis successfully identified naturally occurring phenotypic patterns, revealing two distinct subtypes of pronated feet: rearfoot valgus-dominant and midfoot collapse-dominant phenotypes. This differentiation is consistent with biomechanical literature suggesting that pronation manifests through multiple pathways involving different anatomical structures.22 Previous studies have demonstrated that individuals with flat feet show reduced dynamic balance performance compared to normal foot types, with normalized reach distances typically ranging from 76.9% to 84.3% of leg length in pronated groups versus 84.3% to 89.2% in normal groups.17,23 The clustering approach validates these findings while providing enhanced granularity in understanding foot posture variations.
The differential impact of distinct pronated foot phenotypes on postural control mechanisms provides important insights into the biomechanical basis of balance deficits. The midfoot collapse-dominant phenotype demonstrated more pronounced balance impairments than the rearfoot valgus-dominant type, suggesting that medial longitudinal arch integrity plays a more critical role in dynamic stability than rearfoot alignment alone. This finding aligns with research indicating that midfoot function, evaluated through navicular drop measurements, significantly influences proprioceptive feedback mechanisms and shock absorption during weight-bearing activities.9,10 The superior performance of supinated feet in posterolateral reaching tasks can be attributed to enhanced mechanical stability provided by the rigid high arch structure and increased activation of lateral stabilizing muscles.5 Previous electromyographic studies have demonstrated that individuals with pronated feet exhibit altered muscle activation patterns, particularly increased peroneus longus activity, which may compromise adaptive postural responses during dynamic tasks.24 The age-related phenotype identified in Cluster 3 further supports evidence that chronological aging affects postural control independent of specific foot structural characteristics.25 Despite having relatively preserved foot posture characteristics (moderate navicular drop and RCSP values), this older group (mean age 50.9 years) demonstrated only moderate balance performance, suggesting that age-related sensorimotor decline becomes a more dominant factor than foot biomechanics in this population. Age-related changes including reduced proprioceptive acuity, slower reaction times, decreased muscle strength, and impaired central processing of sensory information may override the influence of foot posture on balance control. This finding indicates that traditional foot-focused interventions may be less effective in older workers, and comprehensive age-appropriate balance training programs addressing multiple sensorimotor systems may be more beneficial for this phenotype. The identification of this distinct age-related phenotype highlights the importance of considering chronological age as a primary factor in occupational health risk stratification, even when biomechanical foot measures appear relatively normal.
The clinical implications of these findings extend beyond academic interest to practical occupational health applications. Logistics service workers face substantial injury risks, with ankle-related incidents accounting for 23% of workplace injuries and resulting in an average of 20 lost workdays per incident.4,11 The identification of specific foot posture phenotypes associated with reduced dynamic balance performance enables more targeted injury prevention strategies. Workers identified with midfoot collapse-dominant pronation patterns may benefit from specific interventions including intrinsic foot muscle strengthening, proprioceptive training, and arch support orthoses.26,27 The clustering approach also supports personalized footwear recommendations, as different foot types may require distinct orthotic designs to optimize both comfort and stability during occupational tasks. Furthermore, the integration of multiple demographic and anthropometric variables in the clustering model provides a comprehensive framework for risk stratification that could be implemented in pre-employment screening or periodic health assessments for logistics workers.
Several limitations warrant consideration in interpreting these findings. The cross-sectional design prevents establishment of causal relationships between foot posture characteristics and balance deficits, and longitudinal studies would be necessary to determine whether these relationships persist over time or change with occupational exposure. The clustering analysis, while data-driven, relied on predetermined variables that may not capture all relevant aspects of foot structure and function. Additionally, the Y-Balance Test, though validated for dynamic balance assessment, represents only one aspect of the complex postural control demands encountered in actual work environments. The study population was limited to logistics workers, which may restrict generalizability to other occupational groups with different physical demands. Finally, our cluster validation relied solely on the silhouette score to determine the optimal number of clusters. While this method is methodologically appropriate, supplementary validation using additional techniques such as the elbow method or gap statistic would have enhanced the robustness and credibility of our four-cluster solution. Future research should investigate the temporal stability of these phenotypic classifications and examine whether targeted interventions can modify cluster membership or improve balance performance within specific phenotypes. Additionally, the incorporation of kinematic and electromyographic measures would provide deeper insights into the underlying mechanisms responsible for the observed performance differences between foot posture clusters.
CONCLUSIONS
Unsupervised machine learning clustering successfully identified four distinct foot posture phenotypes among logistics service workers, revealing that midfoot collapse-dominant pronation patterns demonstrate greater dynamic balance impairments than rearfoot valgus-dominant types. The superior posterolateral reach performance observed in supinated foot phenotypes compared to pronated groups indicates that foot structural characteristics significantly influence occupational-relevant balance capabilities. These findings support the implementation of phenotype-specific interventions for injury prevention in logistics workers, particularly targeted proprioceptive training and arch support strategies for individuals with midfoot dysfunction.