


INTRODUCTION
Stroke is a cerebrovascular disorder characterized by the interruption of blood supply to the brain or bleeding within the brain tissue, leading to the loss of neurological functions, particularly those governing motor and sensory control.1 The incidence of stroke patients continues to rise, and while advancements in medical technology and routine health screenings have contributed to a decrease in stroke-related mortality, the number of individuals living with stroke-related impairments is increasing.2 Moreover, stroke remains a leading cause of adult disability, significantly impairing mobility, and its prevalence is expected to escalate further due to the aging population.3,4
In cases of brain-related diseases such as stroke, paralysis on one side of the body often occurs, leading to a decline in the quality of life for the elderly. Conditions such as hemiplegia have a high incidence and recurrence rate among the elderly.5 Furthermore, most stroke survivors experience systemic impairments such as unilateral paralysis and weakness, which can hinder their ability to perform daily functional activities.6 Post-stroke gait is characterized by decreased walking speed, asymmetry, and an increased step width.7,8 Stroke patients also often develop compensatory movements to compensate for insufficient movement on the paretic side of the lower limb.9 Balaban and Tok specifically noted that foot drop, stiff knee gait, and circumduction gait are commonly observed in stroke patients.10
Gait is one of the key indicators of health for disease prevention and management. Gait and mobility are crucial variables that reflect an individual’s ability to participate independently in community life.11 Therefore, restoring gait ability is one of the primary goals of rehabilitation for stroke patients and a major concern for both patients and their families.12 An appropriate and accurate assessment of the patient’s current condition is essential.13 In fact, accurate diagnosis helps eliminate unnecessary treatments and maximize the utilization of necessary rehabilitation therapies, thereby improving rehabilitation’s effectiveness of rehabilitation.2
To evaluate the effectiveness of rehabilitation and adjust the frequency of sessions accordingly, gait information is essential.5 Among stroke patients, research on gait symmetry has been the most actively conducted area of gait analysis. Studies on gait symmetry enable early diagnosis of diseases through ideal gait patterns and help assess patient mobility based on the degree of gait asymmetry, providing valuable evidence for the diagnosis, treatment, and rehabilitation of patients with lower limb disabilities.14 Although kinematic, kinetic, and electromyographic analysis of gait provides objective and diverse information, they can be costly and time-consuming.15 Additionally, attaching markers or EMG sensors to the body may cause discomfort. Consequently, interest has been growing in methods of gait assessment that avoid such inconveniences. One representative tool is Pedar® (Novel GmbH, Munich, Germany). The Pedar-X system is an in-shoe device based on 99 air pressure sensors, which allows for the analysis of temporal gait variables and plantar pressure distribution across specific regions.
Equipment that monitors foot health and quantitatively evaluates it can be particularly useful for identifying abnormalities in plantar pressure, activity levels, and gait characteristics during the early stages of the disease or throughout rehabilitation following lower limb conditions or injuries.16 Furthermore, identifying abnormal gait patterns and attempting to correct or adjust deviations from normal gait can improve the quality of life and health, especially in older adults.17 Previous studies have mainly focused on the asymmetrical characteristics of stroke patients’ gait regarding kinematic variables, muscle activity, or ground reaction forces. However, research on plantar pressure distribution across different foot regions remains limited. It has been reported that patients diagnosed with stroke experience abnormal foot positions, including structural and movement defects in the unique foot part of the affected side associated with limitation of motility.18 The distribution of plantar pressure during walking was said to reflect the process of gait dysfunction, abnormal walking of the patient, irregular distribution of weight, and pressure change in both legs.19 Therefore, this study aims to use a plantar pressure system to measure gait variables and plantar pressure distribution across seven regions in elderly individuals with hemiplegic stroke, identify differences between the affected and unaffected sides, and analyze plantar pressure distribution and characteristics.
METHODS
The participants of this study were 16 stroke patients living in the community. The number of subjects in this study was determined by referring to similar studies.20,21 After receiving a sufficient explanation of the research purpose and method, the subjects voluntarily signed a consent form. The selection criteria for the subjects were those who had been diagnosed with cerebral hemorrhage or cerebral infarction for more than 6 months, those whose hemiplegia was limited to the left or right side, and those who could walk independently for more than 1 minute. The exclusion criteria for the subjects were those who had severe muscle stiffness and joint contractures that made walking difficult, those with orthopedic diseases and diseases, and those who could not be examined due to other diseases such as cardiopulmonary disease. This study was conducted with the approval of the Institutional Research Ethics Committee of the Rehabilitation Center in Seoul (No. 050432021). The general characteristics of the study participants are shown in Table 1.
The study used the Pedar-X system (Novel, Germany), an insole plantar pressure measurement device. This equipment is a Bluetooth-enabled wireless system that employs thin, 2mm insoles that fit inside footwear. Each insole is equipped with 99 sensors, allowing for the measurement and analysis of temporal gait variables and plantar pressure. The plantar pressure measurement device used in this study showed high accuracy and reproducibility and was evaluated as a reliable tool in clinical and research settings.22 This study set the data sampling frequency at 50 Hz.
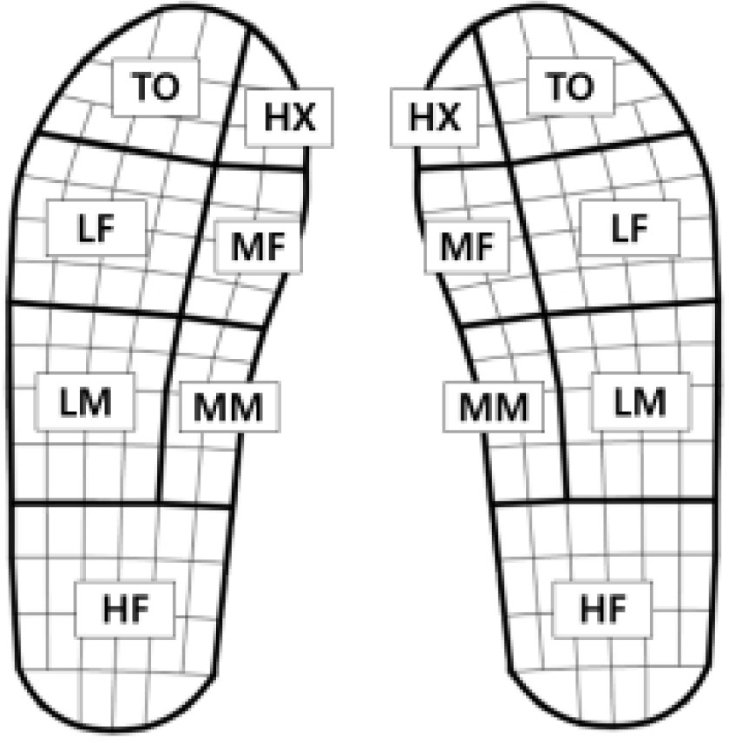
Temporal gait variables measured using the Pedar-X system included stride time, step time, and cadence. The ratio of the stand phase, swing phase, single support, and double support for the gait cycle was measured. Stride time is the time taken from the moment one first touches the ground to the moment it touches the ground again. Step time is the time taken from when one foot touches the ground to when the other touches the ground. The stance phase is where the leg touches the ground, the swing phase is where the leg is off the ground, the single support is where one leg supports the ground, and the double support is where both feet touch the ground. The cadence was calculated by calculating the number of steps per minute. In addition, the plantar pressure variables were measured as maximum force, mean pressure, contact areas, and contact time. Max force means the highest vertical force generated when walking, and the unit is N. The mean pressure is the unit kPa, which is the average of the measured pressure values during the contact time. The contact areas are the total area of the sensors that recorded the pressure for a certain period while the foot was in contact with the ground, and the unit is cm2. The contact time is the time when a value above the critical pressure was recorded at the sensor location in the area. To facilitate comparative analysis between the paretic and non-paretic sides, the foot was segmented into seven regions: Heel (HF), Medial Midfoot (MM), Lateral Midfoot (LM), Medial Forefoot (MF), Lateral Forefoot (LF), Hallux (HX), and Toes (TO), as illustrated in Figure 1.
To compare temporal gait and plantar pressure variables between the paretic and non-paretic sides, measurements were conducted in a laboratory setting with an even 6-meter walkway. Since uneven surfaces could introduce measurement errors in plantar pressure data, assessments were performed on a flat surface. To minimize variability due to different shoe functions and outsole designs among participants, all subjects wore standardized indoor shoes (Slanger, SL-299) provided for the study. The original insoles were removed, and Pedar-X insoles were inserted for measurements. Each participant performed calibration by standing on one leg (paretic and non-paretic sides) for 3 seconds before gait assessment. Because there is a risk of falling due to loss of balance when standing on one leg for calibration, the subject held onto an object, such as a chair, and was assisted by two research assistants on both sides. Subjects were instructed to gait at their usual pace, initiating movement upon the examiner’s signal. A total of four round trips were measured, excluding trials with gait distribution such as step twists or loss of balance, resulting in four gait cycles selected for trials. Next, to exclude the gait propulsion and deceleration phases, three gait cycles, each in the early and late stages of walking were excluded. The average data of temporal gait variables and plantar pressure variables for three gait cycles in the middle of walking were used in this study.
The data collected in this study were analyzed using SPSS software (Version 21.0, IBM, Corp., Armonk, NY, USA). Descriptive statistics were calculated for participants’ general characteristics, including means and standard deviations. The normality test was assessed using the Shapiro-Wilk test to compare measured temporal gait and plantar pressure variables between the paretic and non-paretic sides. Because the results of the Shapiro-Wilk test did not follow the normal distribution(p<.05) we used the non-parametric test Wilcoxon signed-rank test. A statistical significance level of p<.05 was set for this study.
RESULTS
The comparative analysis results of temporal gait variables between the paretic and non-paretic sides are presented in Table 2 and Figure 2. Significant differences were observed in step time, stance phase (% gait cycle), swing phase (% gait cycle), single support (% gait cycle), double support (% gait cycle), and cadence between the paretic and non-paretic sides. Step time was the non-paretic side was 0.66±0.34s and the paretic side was 0.84±0.19s, showing that the paretic side was significantly larger(p<.01). The ratio of the stance phase according to the gait cycle was 55.96±4.51% on the paretic side and 70.66±5.10% on the non-paretic side, which was significantly larger(p<.001). Conversely, the ratio of the swing phase according to the gait cycle was 43.26±4.70% on the paretic side and 28.56±6.34% on the non-paretic side, which was significantly more significant than the paretic side(p<.001). The single support (% gait cycle) was 29.02±7.01% on the paretic side and 48.00±3.90% on the non-paretic side, showing a significantly higher on the non-paretic side(p<.001).
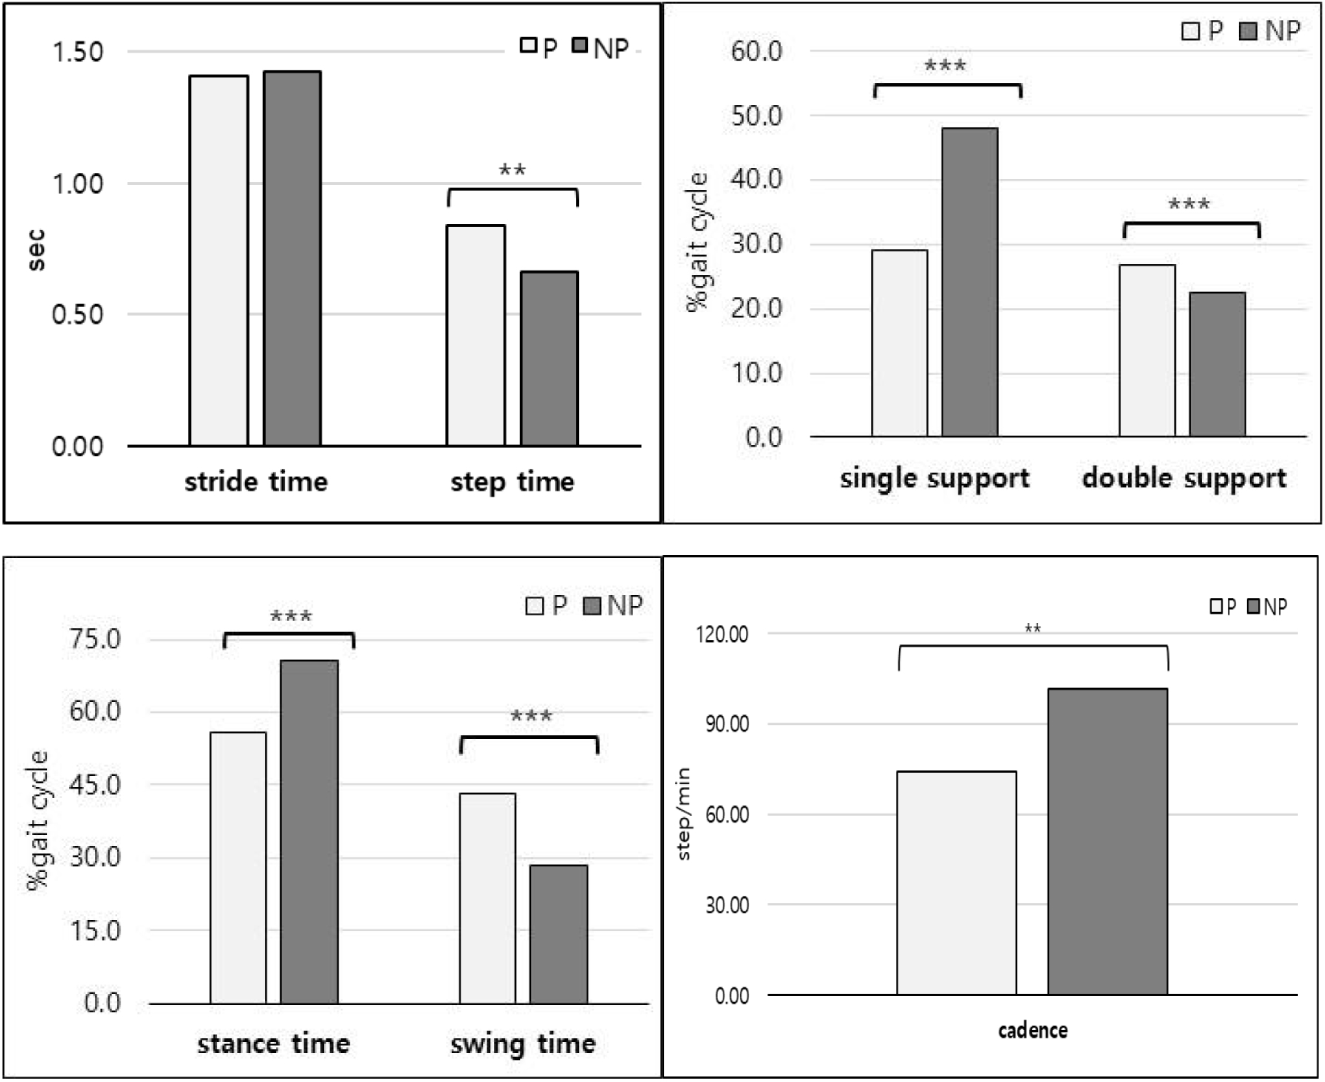
The double support (% gait cycle) was 26.94±6.28% on the paretic side and 22.60±5.05% on the non-paretic side, showed a significantly higher difference on the paretic side (p<.01). Cadence was 74.14±14.52 steps/min on the paretic side and 101.60 steps/min on the non-paretic side, showed a significantly larger the non-paretic side(p<.001). On the other hand, the stride time was 1.41±0.23s on the paralysis side and 1.42±0.25s on the non-paralytic side, showing no significant difference between the paretic and non-paretic sides.
In the plantar pressure variables, the average value of max force, mean pressure, contact areas, and contact time were compared between the paretic and non-paretic sides, with results shown in Table 3, 4, and Figure 3.
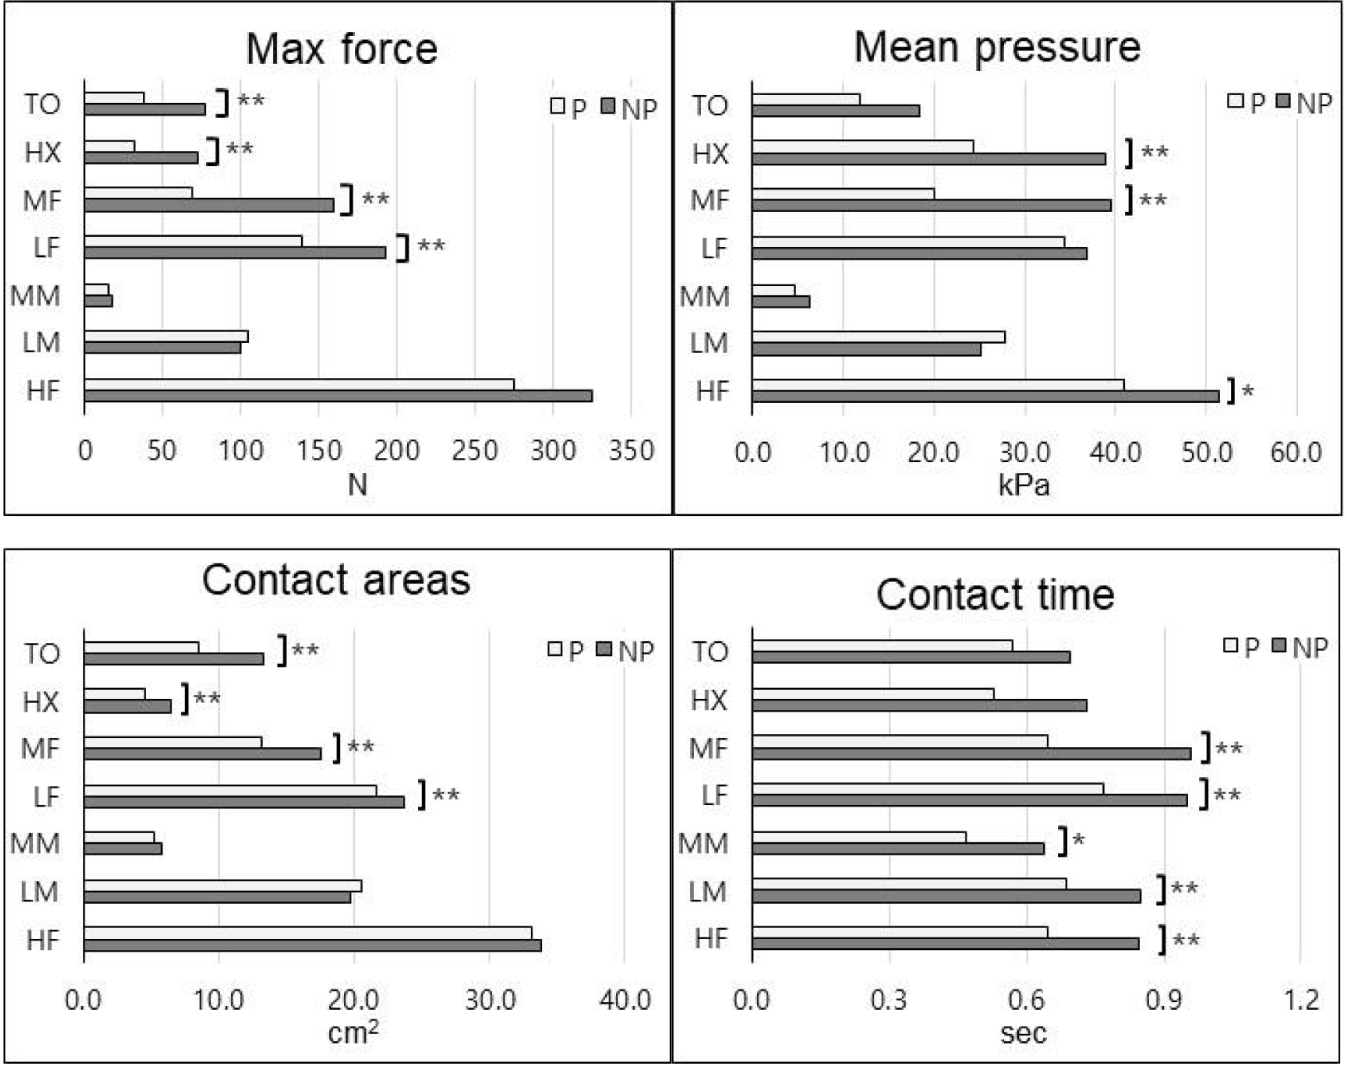
Significant differences were found in max force in the LF, MF, HX, and TO regions between the paretic and non-paretic sides(p<.01). In the LF region, the paretic side was 139.05±65.71N and the non-paretic side was 192.45 ±66.69N, showed that the non-paretic side was significantly larger(p<.01). The MF region was showed 68.57±53.16N on the paralysis side and 159.92±57.43N on the non- paralytic side, which was significantly larger(p<.01). The HX region was showed 31.60±28.10N on the paretic side and 72.75±33.63N on the non-paretic side, and the TO region was showed 37.98±32.51N on the paretic side and 76.98±38.44N on the non-paretic side. HX and TO regions showed the non-paretic side was significantly more significant than the paretic side(p<.01). The HF region showed 274.57±119.72N on the paretic side and 325.02 ±12.78N on the non-paretic side but was not statistically significant. And in the LM region was 105.24±45.92N on the paretic side and 99.38±45.03N on the non-paretic side. And MM region was 15.00±12.74N on the paretic side, 18.08±15.25N on the non-paretic side. Each region was not significant.
Next, in the mean pressure, significant differences were shown between the paretic and non-paretic sides in HF, MF, and HX regions. In the HF region, the paretic side was 40.90±18.49kPa, and the non-paretic side was 51.41± 21.16kPa, showing that the non-paretic side was significantly larger(p<.05). The MF region, the paretic side was 20.11±16.53kPa, and the non-paretic side was 39.58± 13.73kPa, showed that the non-paretic side was significantly larger(p<.01). The HX region, the paretic side was 24.40±20.33kPa, and the non-paretic side was 39.58± 13.73kPa, showed that the non-paretic side was significantly larger(p<.05). In contrast, in the LM region, the paretic side was 27.76±12.30kPa and the non-paretic side was 25.05±11.53kPa, showed that the paretic side was relatively larger, but there was no significant difference. In the MM region, the paretic side was 35.82±18.78kPa, and the non-paretic side was 40.55±18.67kPa, showing that the non-paretic side was relatively larger, but there was no significant difference. In the LF region, the paretic side was 34.43±15.63kPa, and the non-paretic side was 36.76± 10.42kPa, showing that the non-paretic side was relatively larger, but there was no significant difference. Finally, in the TO region, there was 11.88±9.44 kPa on the paretic side and 18.43±9.55 kPa on the non-paretic side, showing a relatively larger value on the non-paretic side, but there was no significant difference. Regarding contact area, significant differences were observed in the LF, MF, HX, and TO regions between the paretic and non-paretic sides. The LF region was 21.67±5.10 cm2 on the paretic side and 23.75±1.93 cm2 on the non-paretic side, showed that the non-paretic side was significantly larger(p<.01). In the MF region the paretic side was 13.23±5.47cm2, while the non-paretic side was 17.61±1.37cm2, showed that the non-paretic side was significantly larger(p<.05). The HX region was 4.61±2.79cm2 on the paretic side and 6.41±2.02cm2 on the non-paretic side, showed that the non-paretic side was significantly larger(p<.05). Similarly, in the TO region, the non-paretic side was 13.29±4.40cm2 and paretic side was 8.52±5.44cm2, showed a significantly larger(p<.05).
In contrast, not significant differences were shown in the HF, LM, and MM regions. Specifically, the HF region, showed 33.10±10.01cm2 on the paretic side and 33.87±9.55cm2 on the non-paretic side. The LM region was 20.53±6.14cm2 on the paretic side and 19.69±6.55cm2 on the non-paretic side. In the MM region, the paretic side was 5.20±4.07 cm2, and the non-paretic side was 5.74±4.38 cm2.
Lastly, significant differences were identified in the HF, LM, MM, LF, and MF regions for contact time between the paretic and non-paretic sides. In the HF region was 0.65±0.26s on the paretic side and 0.85±0.37s on the non-paretic side, significantly longer than the paretic side(p<.01). The LM region was 0.69±0.25s on the paretic side and 0.85±0.34s on the non-paretic side, showed a significantly greater difference in the non-paretic side(p<.01). The MM region was 0.47±0.27s on the paretic side and 0.64±0.39s on the non-paretic side, showed a significantly greater difference in the non-paretic side(p<.05). Similarly, in the LF region, the paretic side was 0.77±0.18s and non-paretic side was 0.95±0.27s, exhibited a significantly longer difference in the non-paretic side(p<.01). The MF region was 0.65±0.23s on the paretic side and 0.96±0.32s on the non-paretic side, which was significantly larger in the non-paretic side(p<.01).
DISCUSSION
Stroke, an acute disease caused by rupture or occlusion of a cerebral blood vessel, is a significant cause of disability in the elderly worldwide.23,24 Stroke patients typically exhibit impaired gait abilities, characterized by reduced gait speed, stride length, step length, and asymmetric gait patterns.25-27 Rogers et al.28 suggested that to improve gait ability in stroke patients, it is essential to investigate changes in plantar pressure during gait. Accordingly, this study conducted a gait analysis using a foot pressure system for stroke patients over 65 years of age and analyzed foot pressure patterns by subdividing them into 7 areas. The research results are summarized as follows. The step time on the non-paretic side was shorter, and the single support, stance phase, and cadence were larger, while the swing phase on the paretic side was larger. The distribution of plantar pressure was higher on the non-paretic side in most areas, and the analysis of the distribution of plantar pressure on the paretic side confirmed an asymmetric characteristic in which the lateral area of the foot was mainly used to support the ground and the forefoot of the foot was not accurately supported, making it difficult to obtain walking propulsion.
First, regarding the temporal gait variables measured using the plantar pressure system, significant differences were observed between the paretic and non-paretic sides in all variables except for stride time. The non-paretic side showed a longer stance phase, single support, and cadence, and the paretic side exhibited a longer step time, swing phase, and double support. This is thought to be due to the asymmetric gait characteristics that depend on the non-paretic side because stability is not secured due to muscle weakness and joint stiffness in the paretic lower extremity caused by stroke. It was reported that dorsiflexion is limited due to joint stiffness in the paretic lower extremity when walking due to motor nerve damage in stroke patients,29 and it is thought to support the content reported that the stance phase time and stride length of the paretic lower extremity decrease because it is difficult for the heel to contact the ground during the stance phase.30 In this way, due to the asymmetry of gait between the paretic and non-paretic side after a stroke, the non-paretic side showed a higher cadence, which means the number of steps per minute. This is thought to be because the swing phase of the non-paretic side is shortened to compensate for the instability of the paretic side and the non-paretic side gait with fast steps.
Next, the plantar pressure variables between the paretic and non-paretic sides were analyzed. Kimura et al.31 stated that plantar pressure distribution reflects a patient’s gait ability. Therefore, measurement and analysis of plantar pressure distribution during gait is a key variable in understanding gait characteristics. First, in terms of max force and contact area, the paretic side’s MF, LF, TO, and HX regions were significantly lower than the non-paretic side. This is thought to be because the lower extremity on the paretic side does not gain propulsion while moving the center of mass to the front of the foot during gait. This finding aligns with previous research reporting that the propulsive ground reaction force (GRF) directed forward is reduced on the paretic side after stroke and is associated with gait impairments and slower gait speeds.32,33 Furthermore, due to muscle weakness and joint stiffness, stroke patients tend to carefully place the paretic foot on the ground for stability, whereas the non-paretic side shows higher instantaneous pressure due to quicker steps.
The mean pressure variable also showed significant differences between the paretic and non-paretic sides, particularly in the HX and MF of the forefoot regions. However, unlike the max force results, no significant differences existed in the TO and LF regions. This might be due to compensatory mechanisms during gait on the paretic side. Stroke patients often show compensation for various gait patterns due to hemiplegia. Especially foot drop, stiff knee gait, and circumduction gait are frequently observed.10 Unlike the maximum force variable, a significant difference was found only in the large TO and MF region, which is thought to have a high average pressure on the non-paretic side to extend the paretic side in the walking direction. Additionally, significant differences in the heel region were observed. In the case of the HL region, it is thought that high pressure was observed because the non-paretic side had to take a quick step due to the instability of the paretic side, making it difficult to support it on the ground. It is also thought that the pressure on the HL is high to achieve a stable balance when the swing phase is initiated on the paretic side.
Previous studies reported that the plantar pressure pattern on the lateral side showed the highest pressure in the heel, and the pressure in the middle and anterior regions was low.34 In this study, it was confirmed that the pattern of foot pressure on the paretic side was the same. Due to the weakness of the paretic side and joint stiffness because of hemiplegia, the ground could not be accurately contacted when walking, and plantar pressure patterns were difficult to obtain walking propulsion. It has been reported that the during gait propulsion is determined by ankle plantar flexor moments35 and the trailing limb angle (TLA).36-38 This likely results from a decreased joint range of motion due to joint stiffness on the paretic side. Also, although not statistically significant, the LF area was confirmed to have a higher max force, mean pressure, and contact area on the paretic side compared to the non-paretic side. This finding is consistent with previous reports stating that due to inversion and toe flexion on the paretic side, plantar pressure during the stance phase is concentrated lateral area rather than being transmitted to the forefoot.39 The variables of contact time and significant differences were confirmed in all regions except the TO. If the center of mass is in contact with the TO for a long time and the gait propulsion on the non-paretic side is taken, the instability of the initial stance phase on the paretic side increases, so it is thought that the contact time was small in the TO region on the non-paretic side. In addition, it was confirmed that the non-paretic side had contact for a longer time than the paralyzed side in all areas. This appears to be consistent with reports that stroke patients exhibit equinovarus foot deformity, genu recurvatum, and ankle spasticity on the paretic lower limb,40,41 making it difficult to maintain a prolonged weight-bearing stance on the paretic side.42
Improving asymmetric gait post-stroke is crucial in rehabilitation, serving as a key factor in evaluating the effectiveness of therapeutic interventions. Since asymmetric gait can interfere with intervention and worsen over time, gait symmetry can be an essential parameter in the path of rehabilitation and monitoring the rehabilitation process.43 Moreover, the rapid progression of an aging society has led to an increased number of orthopedic and neurological chronic disease patients, posing a significant burden on healthcare facilities and staff.44 As observed in this study, persistent asymmetrical gait may lead to orthopedic joint deformities and reduced mobility, potentially lowering the quality of life. Jung et al.45 emphasized the urgent need for technology that enables early detection of disease symptoms and emergency situations through daily life monitoring of elderly individuals, allowing for timely medical intervention. In this study, the paralyzed side showed greater plantar pressure in the outer area of the foot and a pattern of inability to support the ground on the paralyzed side. Therefore, rehabilitation methods and therapeutic interventions will be necessary to ensure accurate ground contact of the foot and support of the ground on the paretic side. Based on the results of this study, it is thought that it can help develop or improve rehabilitation exercises, physical therapy, and health programs aimed at achieving symmetrical gait in elderly and adult stroke patients.
This study has several limitations. First, the subjects of this study were elderly people with strokes who voluntarily expressed their willingness to participate, so the number of subjects was small, making it difficult to generalize the gait characteristics of all elderly people with strokes. In addition, the difference in walking function according to the duration of the onset and the difference according to the type of lesion (cerebral hemorrhage, cerebral infarction) and location were not considered. Next, since the evaluation was conducted without limited speed during the gait evaluation, there is a possibility of errors in gait variables. Lastly, the assessments were conducted on flat ground to prevent secondary injuries such as falls, making it difficult to generalize the findings on daily life environments involving uneven surfaces or slopes. Future research should address these limitations by conducting studies on stroke patients under controlled walking speeds and varied surface conditions to investigate gait characteristics further.
CONCLUSIONS
This study identified the asymmetrical characteristics of gait parameters and plantar pressure variables between the paretic and non-paretic sides in elderly individuals with hemiparetic stroke using a plantar pressure system. Based on the results of this study, the findings may serve as objective data for designing and developing rehabilitation programs to improve gait and balance in elderly stroke patients. Additionally, the quantitative data provided can be used to establish objective rehabilitation goals, which may contribute to achieving more positive rehabilitation outcomes. Finally, regular gait assessments using a plantar pressure system during rehabilitation are expected to be effective in evaluating rehabilitation progress and applying for appropriate rehabilitation programs at the optimal time.