INTRODUCTION
Food service workers (FWs), including cooks and restaurant staff, face a heightened risk of musculoskeletal pain due to the physical demands of their jobs, such as serving, food preparation, dishwashing, and cooking.1-4 Numerous studies have reported a high prevalence of musculoskeletal pain in this occupational group, with the neck (54.3%) and shoulders (57.9%) being the most commonly affected body regions.5,6
Myofascial pain (MP) is a leading cause of musculoskeletal discomfort,7 and the upper trapezius muscle (UT) is particularly susceptible to MP.7,8 Tenderness in the muscles is a common clinical observation in cases of suspected muscular pain.9,10 To quantify pain sensitivity in deep tissues, pressure pain sensitivity (PPS) is employed as a neurophysiological test.11 PPS and tissue tenderness are thought to be measurable through this test because they are believed to decrease test values.11 Although the underlying mechanism of MP remains unidentified, it may involve central sensitization, characterized by the central nervous system’s hyperresponsiveness and hyperexcitability.12,13 However, the factors that elevate the risk of developing pressure pain hypersensitivity (PPH) in terms of neurophysiological hyperresponsiveness and hyperexcitability are still unclear.
Abnormal neck and scapula posture can also contribute to shoulder pain, as corroborated by previous studies examining factors influencing UT pain associated with MP.14In the sagittal plane, forward head posture is characterized by an anterior position along the postural line15 and may be accompanied by reduced range of motion, pain, muscle stiffness, and spinal degenerative changes. Forward head posture is indicative of shortened UT and levator scapulae muscles, resulting in elevated scapulae. Correcting abnormal alignments is necessary to facilitate optimal motion.14,16 Additionally, abnormal scapular alignment has been suggested as a potential cause of UT pain.16,17 Such abnormalities include scapular depression, downward rotation, and abduction.16 A downwardly rotated, depressed, or abducted scapula, often associated with rounded shoulders, leads to lengthening of the UT,18,19 resulting in increased tension and reduced pressure pain threshold (PPT) in the UT.17
Most research on classifying PPH or MP at UT has traditionally used linear or logistic regression as statistical methods to identify key contributing factors, depending on whether the outcomes are continuous or binary.20 However, these methods have limitations when the relationships between the outcome (or logit of the outcome) and the contributing factors are nonlinear. In contrast, machine learning (ML) is gaining prominence for classification models due to its ability to model both highly nonlinear and linear relationships.21 It has been recommended for achieving higher accuracy compared to traditional statistical methods.20,21
Therefore, the primary objective of this study is to develop, evaluate, and compare the predictive performance of ML models and logistic regression for classifying FWs with and without PPH based on postural analysis data (forward head posture, rounded shoulder angle, and scapular downward rotation ratio). Additionally, the secondary aim is to identify significant contributing factors that impact PPH and provide insights into a model that can aid in the prevention and management of PPH among FWs by addressing these factors.
METHODS
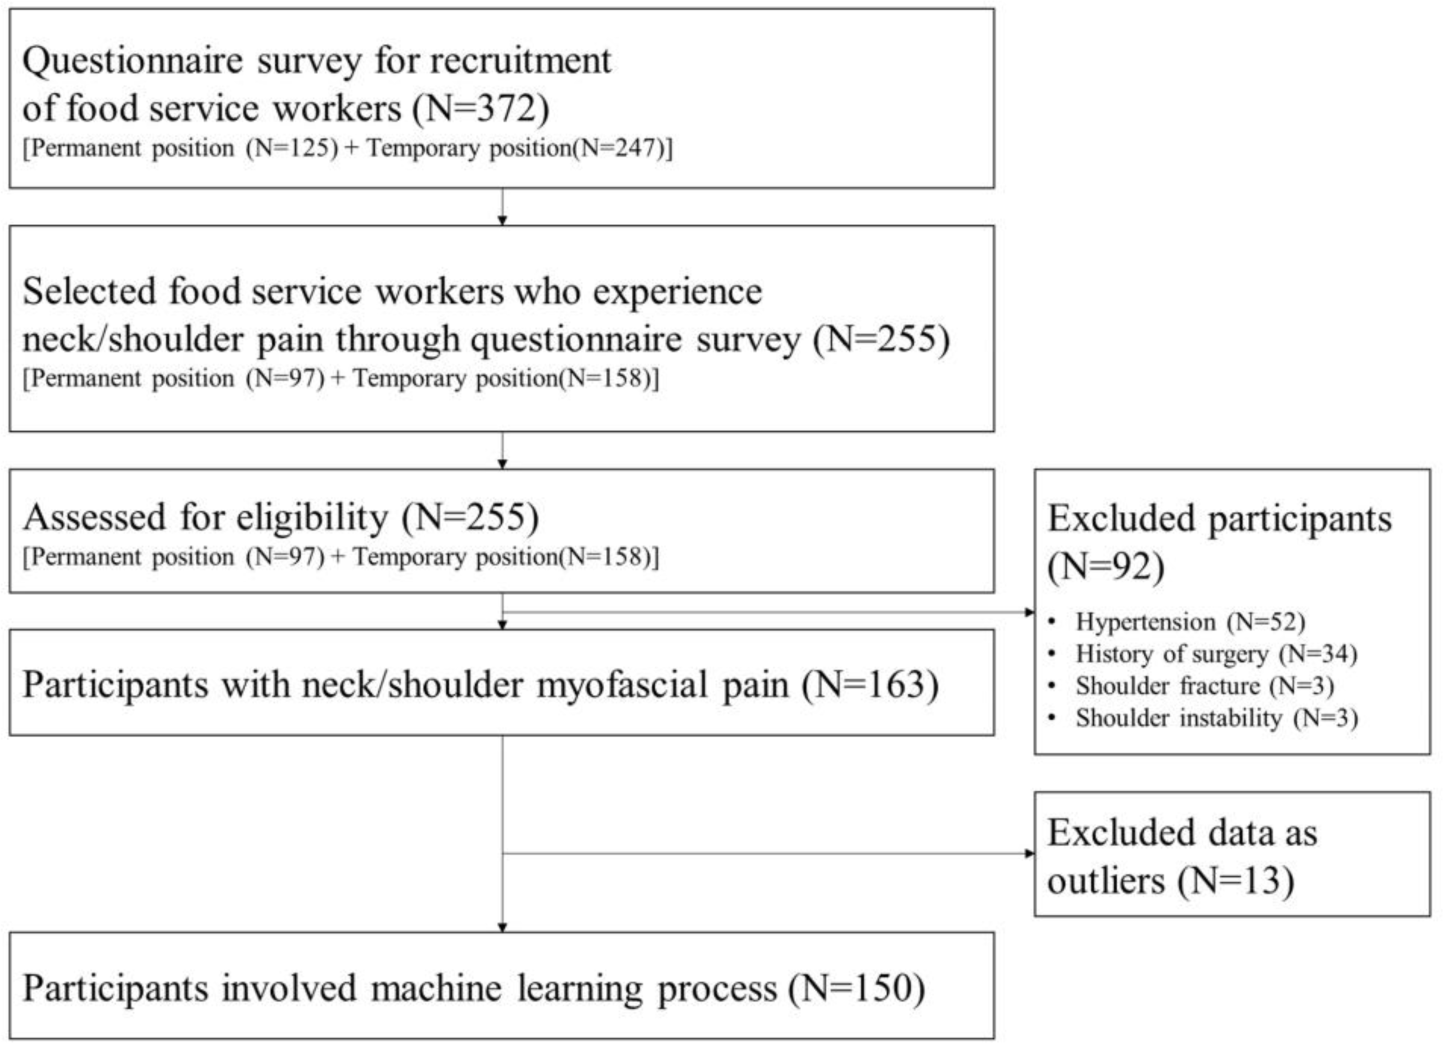
Participants for this study were enlisted through a questionnaire to ascertain their experience of neck/shoulder MP as FWs. A total of 163 individuals suffering from neck/ shoulder MP were included, selected from a pool of 372 FWs employed at a theme park. The present study was performed from March 2016 to November 2016. A flowchart for recruitment of the participants is shown in Figure 1. Participants were assessed at the work conditioning center in a theme park. The inclusion criteria mandated non-traumatic neck and shoulder pain, a minimum of six months of work experience in food service, neck and shoulder pain persisting for at least three months, and a visual analog scale (VAS) score exceeding 3 points. Exclusion criteria encompassed individuals with shoulder fractures, a previous diagnosis of shoulder instability, a history of shoulder surgery, any systemic diseases, untreated psychiatric conditions, indications of neurological or internal diseases upon examination, hypertension (defined as resting systolic blood pressure exceeding 150 mm Hg or diastolic blood pressure exceeding 90 mm Hg), and pregnancy. Details about the participants’ characteristics can be found in Table 1. This research protocol was granted approval by the Yonsei University Mirae Campus Institutional Review Board (certification number: #1041849–201603-BM-005–02). Prior to any assessment, the investigator provided a comprehensive explanation of the entire experimental procedure, and all participants voluntarily gave their informed consent.
To gauge PPS, we employed a pressure algometer (FPK 60, Wagner Instruments, Inc., Greenwich, CT, USA). This device featured a rubber-tipped probe with a 1 cm diameter, connected to a strain gauge that displayed measurements in kg/cm2. PPS assessment was conducted with the participant seated upright, targeting a standardized location on the upper trapezius (UT) muscle, precisely between the C7 vertebra and the acromion process. It’s worth noting that inter-rater reliability was high, with an intraclass correlation coefficient of 0.91.22,23 In our study, we defined PPS as the minimum pressure level at which the sensation of pressure transitioned into slight pain or discomfort, consistent with previous research.22-24 To ensure accuracy, we conducted three trials for each participant and calculated the mean value for the primary analyses. We implemented a one-minute resting interval between each recording to avoid any potential bias. Both the participant and the examiner were kept unaware of the force readings throughout the assessment process. Additionally, we used a standard metronome to control the rate at which pressure was applied.
In terms of PPH classification, men with pressure pain sensitivity measuring less than 2.9 kg/cm2 in the UT and women with pressure pain sensitivity measuring less than 2.0 kg/cm2 in the UT were categorized as having PPH.4,25
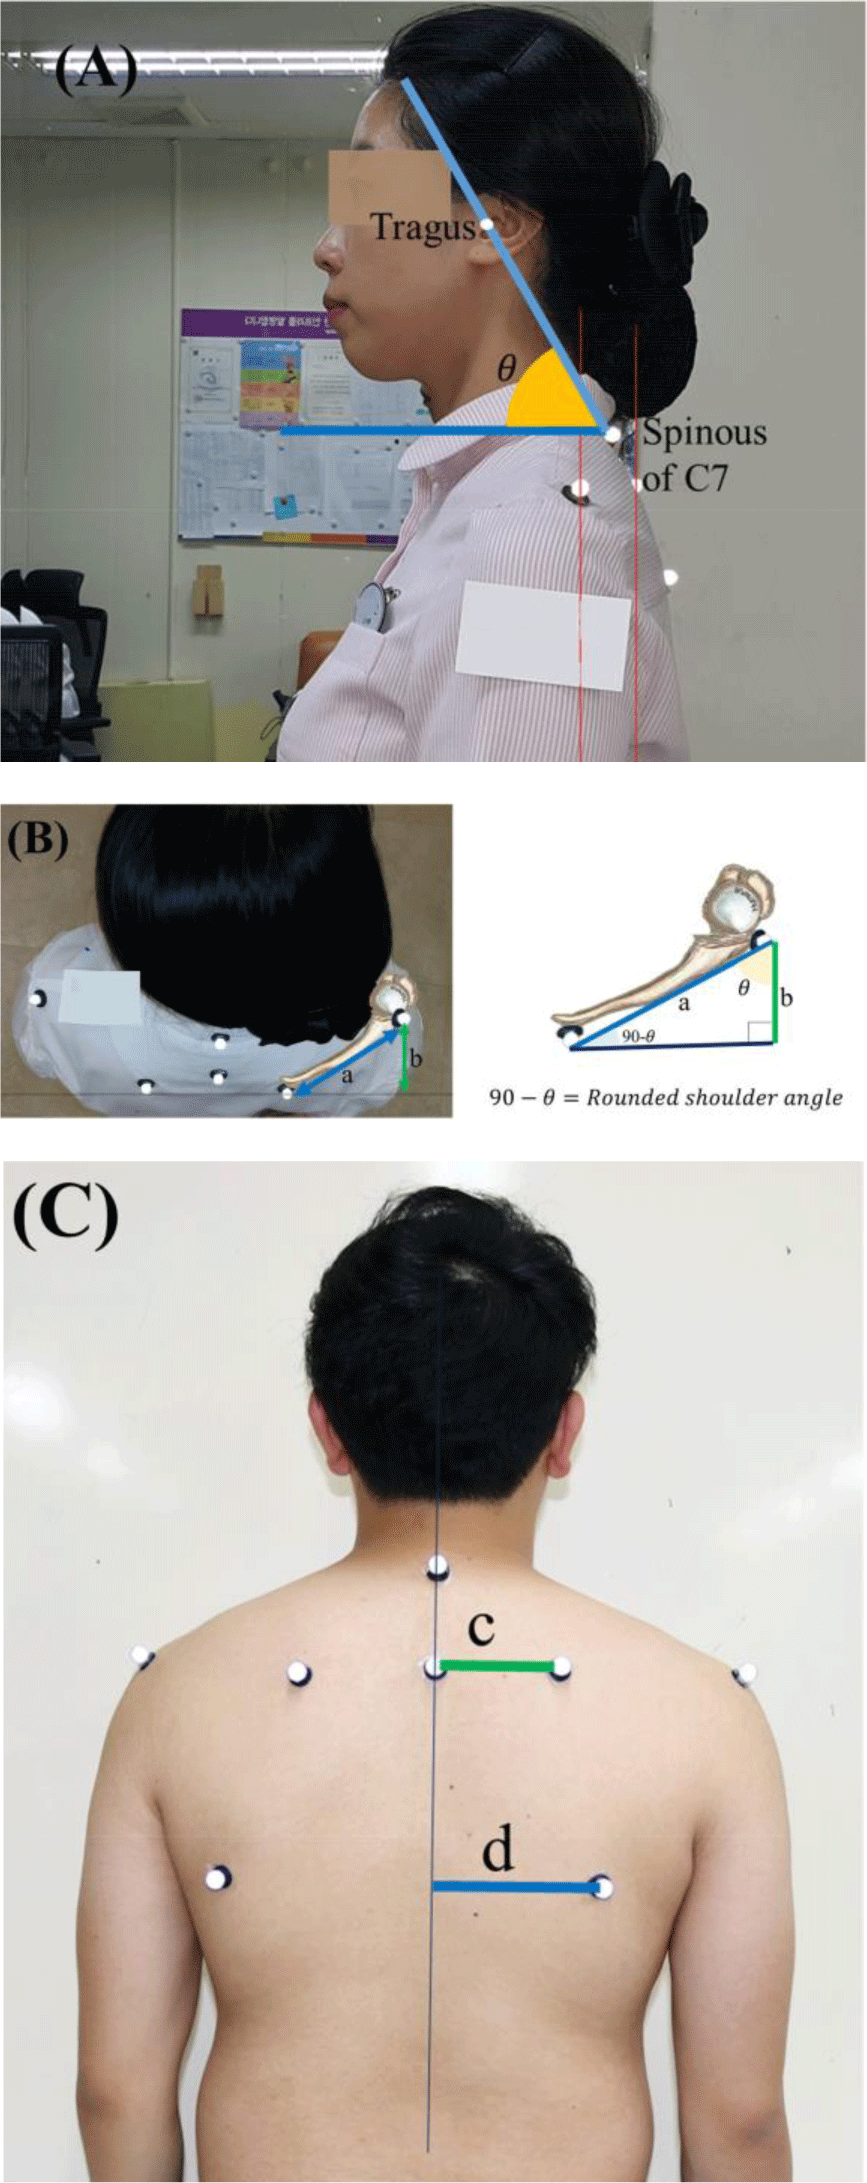
We used a camera (EOS 100D, Canon, Japan) to measure forward head posture, rounded shoulder angle, and scapular downward rotation ratio in the sagittal, transverse, and frontal planes. To facilitate this measurement, retro-reflective markers were strategically placed on specific anatomical landmarks, including the scapular acromions, the seventh cervical vertebra (C7), medial roots of the scapula, and the inferior angles of the scapula.26,27 Photographs were taken in the lateral, transverse and posterior views while subjects maintained a frontal gaze in a standing position. The camera, positioned on a tripod, was situated 140 cm from the floor and 250 cm away from the subjects, aligned perpendicular to the camera in the lateral and posterior photographs. Transverse photographs were captured with the camera at a height above 60 cm and below 10 cm from the subject’s head.
For posture analysis, we utilized ImageJ software (National Institutes of Health, Bethesda, MD, USA) to conduct kinematic assessments of the photographs. Specifically, we quantified forward head posture by measuring the craniovertebral angle, which is the angle between the horizontal line passing through C7 and a line extending from the tragus of the ear to C7 (Figure 2). The rounded shoulder angle was determined by calculating the angle (θ) between two lines: one extending from a horizontal line in the medial roots of the scapula to the acromion, and the other from the root of the scapula to the acromion. To define the rounded shoulder angle, we subtracted θ from 90 degrees (Figure 2).26 Finally, the scapular downward rotation ratio was quantified as the ratio between two lines: a vertical line drawn from the center to the root of the scapula and another vertical line drawn from the center to the scapular inferior angle (Figure 2).26

We conducted our machine learning (ML) analysis using Orange data mining software (Version 3.3.0, developed in Ljubljana, Slovenia) in conjunction with Python (Version 3.6.15, developed by the Python Software Foundation). In addition, we performed independent t-test to compare baseline characteristics between FWs with and without PPH.
Our study incorporated six predictors, including five numeric variables (age, BMI, forward head posture, rounded shoulder angle, and scapular downward rotation ratio) and one categorical variable (sex). The target variable was transformed into a dichotomous variable, distinguishing between those with and without PPH. To address missing data, we performed exploratory data analysis and eliminated instances with unknown values. We carefully examined the distribution of each variable using various visualization methods, including boxplots, scatterplots, and linear projections. Outliers were eliminated because of potentially impact the model’s accuracy. We employed a local outlier factor (with parameters set at a contamination rate of 10%, 20 neighbors, and the Euclidean metric) to detect and remove outliers.
The complete dataset, consisting of 150 cases (with 13 cases removed as outliers), was divided into two subsets: a training set (comprising 80% of the data, totaling 120 samples) used for constructing predictive models, and a test set (representing 20% of the data, totaling 30 samples) for external validation to assess model performance. We implemented six distinct ML algorithms: logistic regression, neural network, random forest, gradient boosting, decision tree, and support vector machine. These algorithms underwent training using a 10-fold cross-validation approach.
The primary metric for evaluating model performance was the calculation of the area under the curve (AUC), determined for both the training and test datasets. We focused on the target class, calculating averages across all classes. Additionally, we considered secondary indicators of model performance, including classification accuracy, recall, precision, and F1 score (which combines recall and precision harmoniously), for both the training and test data, also with the same target class being the average across all classes. We categorized the predictive model’s performance as excellent (AUC≥0.9), good (AUC between 0.8 and 0.9), fair (AUC between 0.7 and 0.8), or poor (AUC<0.7) based on the AUC value.21
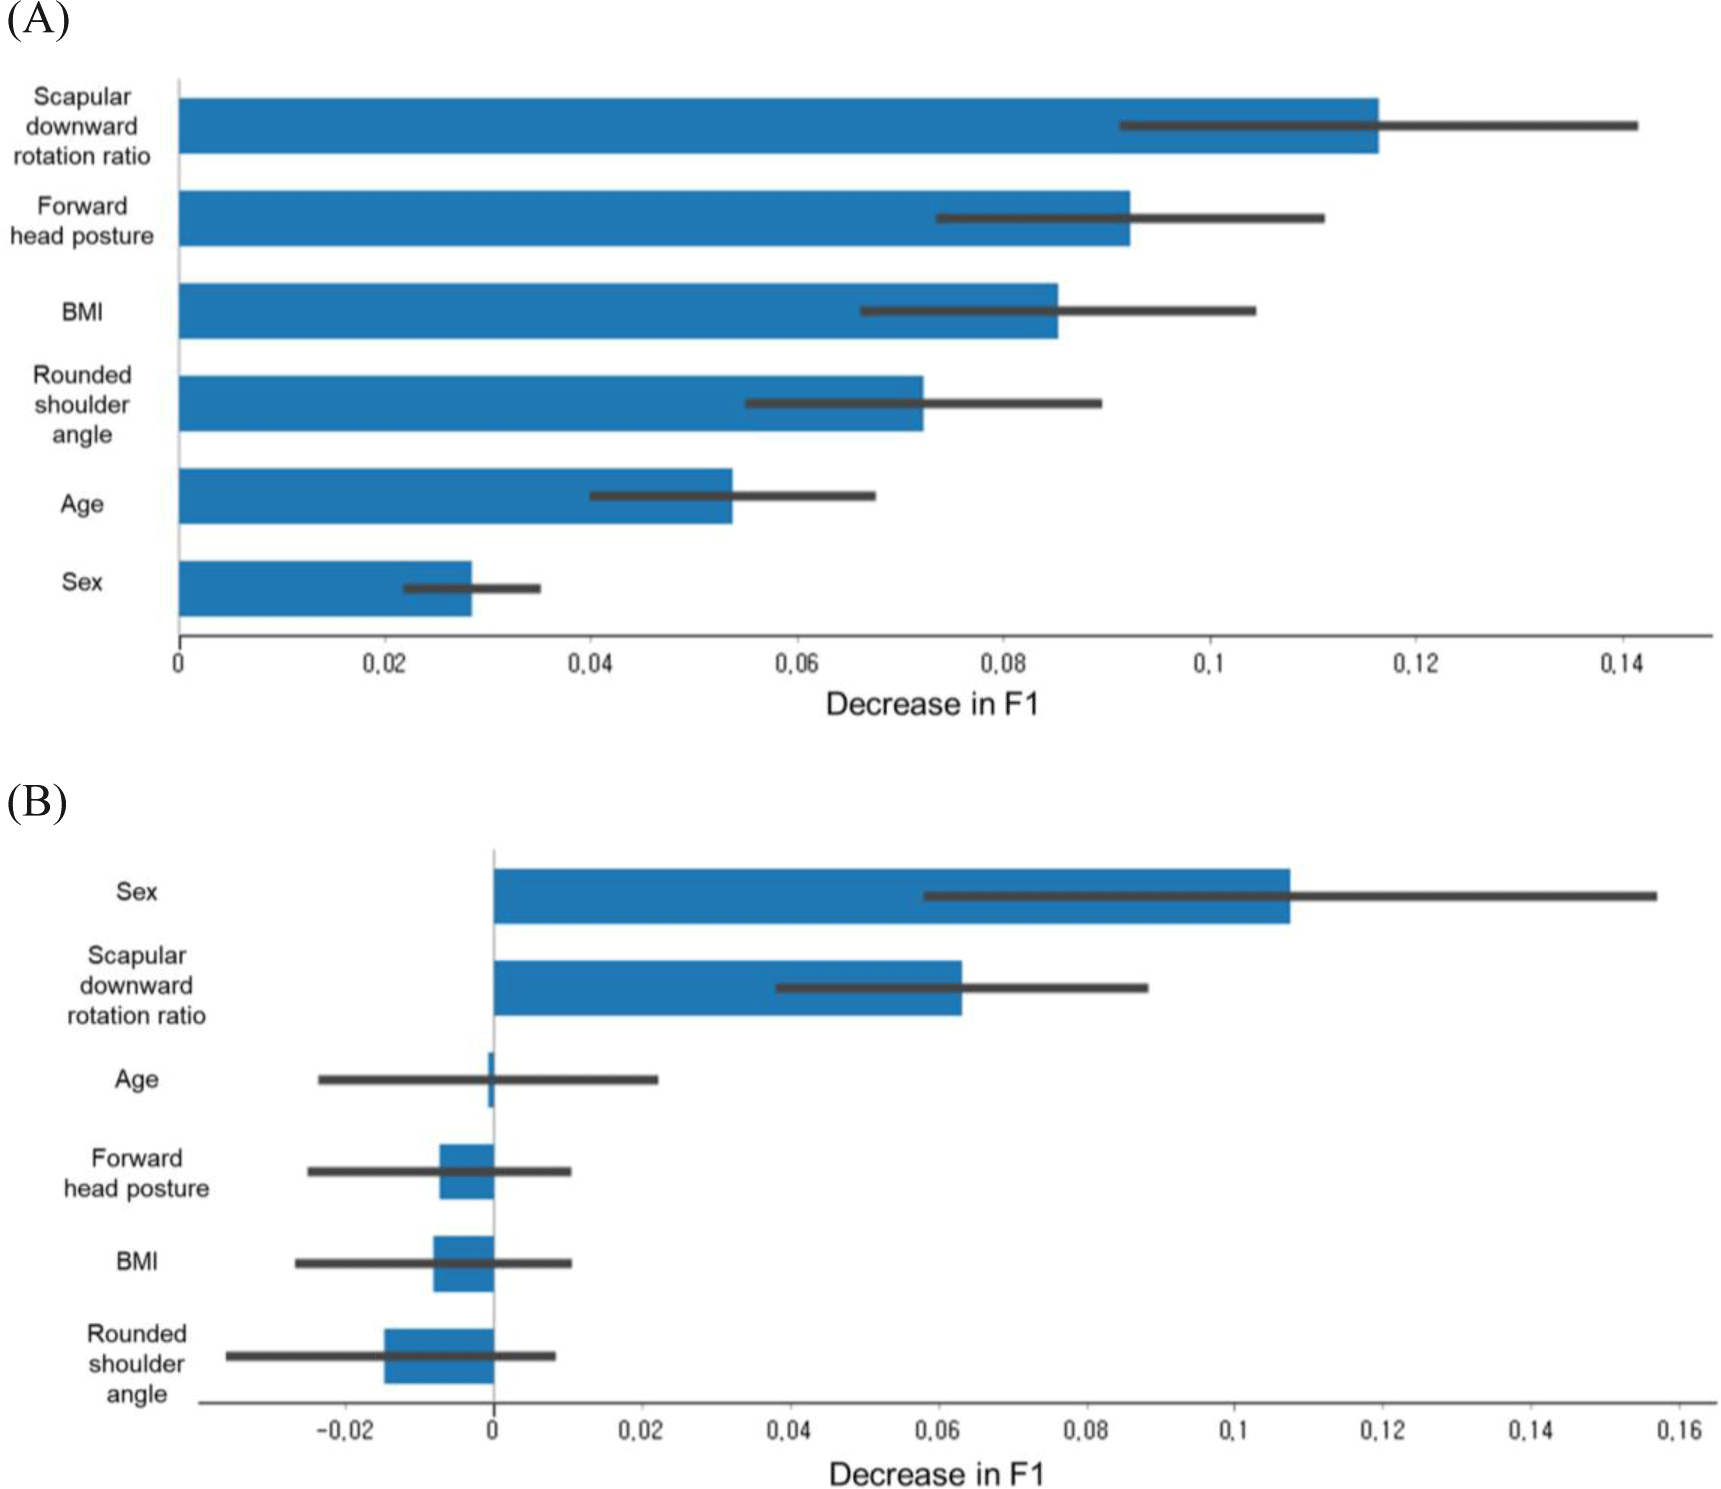
To confirm the significance of each predictive variable, we calculated the importance of feature permutation using the training data. This analysis assessed the contribution of each feature to the model’s performance, measuring its impact on the F1 score and, consequently, any increase in the model’s prediction error.
RESULTS
A total of 150 FWs (60 men and 90 women) were included in the ML analysis, with a PPH proportion of 57.3%. Means and standard deviations of VAS for UT pain intensity was 51.68±20.00 and 50.88±19.10 in FWs with and without PPH, respectively. The means and standard deviations of all variables are provided in Table 1.
The performance of the six ML models for predicting the PPH during model training and testing is shown in Tables 2, and the most important predictors of the best performance in gradient boosting and of logistic regression are described in Figure 3, respectively.

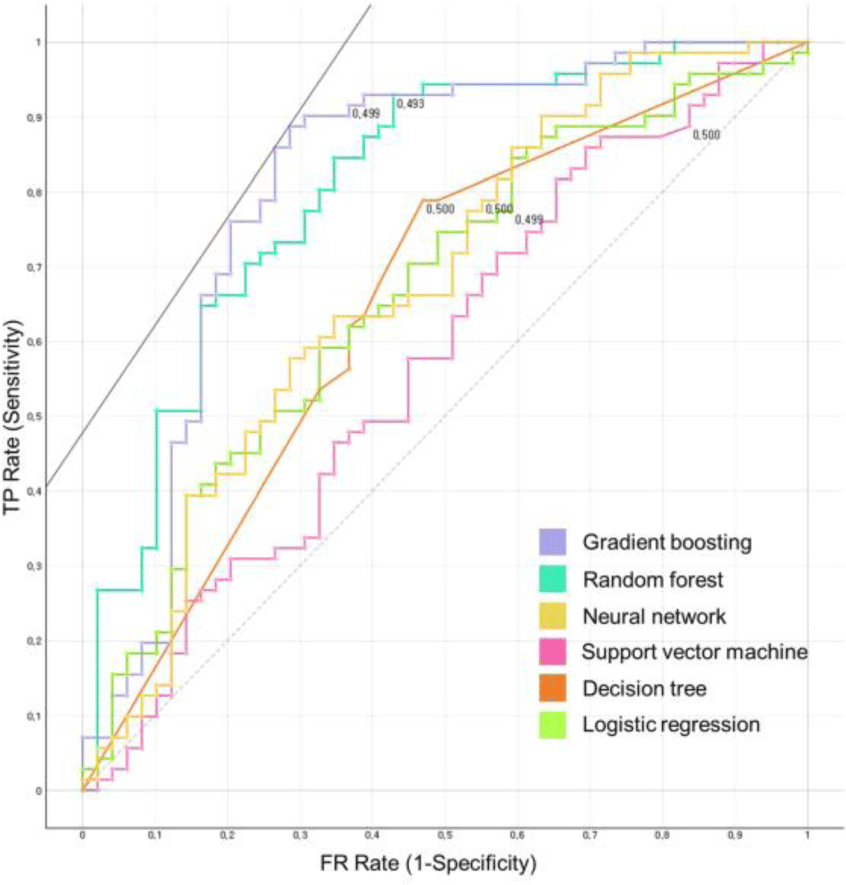
Six ML models in the training dataset classified FWs with and without PPH, performed in the order of high AUC, gradient boosting (AUC,0.812 [good]; F1, 0.786; accuracy, 0.792), random forest (AUC, 0.809 [good]; F1, 0.765; accuracy, 0.775], neural network (AUC, 0.675 [poor]; F1, 0.639; accuracy, 0.650), logistic regression (AUC, 0.665 [poor]; F1, 0.622; accuracy, 0.633), decision tree (AUC, 0.653 [poor]; F1, 0.643; accuracy, 0.642), and support vector machine (AUC, 0.577 [poor]; F1, 0.623; accuracy, 0.650) (Table 2 and Figure 4). In the test dataset classification of FWs with and without PPH, six ML prediction models were performed in the following order: high AUC, gradient boosting (AUC,0.867 [good]; F1, 0.722; accuracy, 0.766), random forest (AUC, 0.822 [good]; F1, 0.778; accuracy, 0.733], logistic regression (AUC, 0.613 [poor]; F1, 0.629; accuracy, 0.567), decision tree (AUC, 0.538 [poor]; F1, 0.562; accuracy, 0.533), support vector machine (AUC, 0.493 [poor]; F1, 0.619; accuracy, 0.467) and neural network (AUC, 0.467 [poor]; F1, 0.564; accuracy, 0.433) (Table 2).

Regarding feature permutation importance, scapular downward rotation ratio, forward head posture, BMI and rounded shoulder angle were the top four important predictors of PPH in gradient boosting model. The sex, scapular downward rotation ratio, age and forward head posture were the top four important predictors of PPH in the logistic regression (Figure 3).
DISCUSSION
The present study confirmed that the gradient boosting model classified FWs with and without PPH and performed the best AUC among the six ML algorithms, using training data (AUC, 0.812 [good); F1, 0.786] and test data (AUC, 0.867 [good); F1, 0.722]. Otherwise, logistic regression model performed the lower AUC than gradient boosting model, using training [AUC, 0.665 (poor); F1, 0.643] and test data [AUC, 0.613 (poor); F1, 0.629]. Traditional statistical methods like logistic or linear regression offer certain benefits, such as creating clinical models that are easy to understand and the availability of various free and commercial software tools for conducting these analyses.20,21 However, these methods face limitations when dealing with nonlinear relationships between the outcome (or logit of outcome) and predictors, especially when there’s a high number of candidate predictors relative to the sample size.21 One significant difference between traditional statistics and machine learning lies in their primary focus: traditional statistics prioritize inference, which involves understanding the data generation process, while machine learning places a greater emphasis on prediction. Machine learning has an advantage in that it offers a range of algorithms capable of modeling highly complex nonlinear relationships. In addition, optimal machine learning models can incorporate multiple interacting factors, allowing for consistent and precise predictions, irrespective of whether each factor has been confirmed as an independent risk factor through conventional regression analyses.28
Donatelli (2012) proposed that in order to establish an appropriate treatment plan for shoulder pain, physical therapists or clinicians should conduct an assessment that takes into account the examination of both neck and shoulder posture.14 This is because incorrect positioning of the neck and scapula can also contribute to neck and shoulder pain. However, because the type of posture analysis that needs to be checked has many elements to check in the three planes (frontal, sagittal and transverse plane), there were no guidelines as to which posture should be evaluated first according to the importance related to PPH. Recently, ML techniques have been applied to patients with musculoskeletal disorders and have been touted to offer superior predictive accuracy compared to traditional statistical methods. Which postural variables is more important for classifying individuals with and without PPH, based on ML techniques? Also, how does machine learning classify PPH through priorities among these variables? The research identifies important predictors for PPH using both ML and logistic regression. In the gradient boosting model, in order of importance, scapular downward rotation ratio, forward head posture, BMI, and rounded shoulder angle emerge as the top predictors. In logistic regression, in order of importance sex, scapular downward rotation ratio, age, and forward head posture play significant roles. These findings shed light on the key factors that may contribute to PPH among FWs. Understanding these predictors can help in designing targeted interventions to alleviate and prevent PPH.
Interestingly, there were no significant statistical differences between subjects with and without PPH regarding the forward head posture (p=0.255), rounded shoulder angle (p=0.363), and scapular downward rotation ratio (p=0.098). Despite this lack of statistical difference between FWs with and without PPH, gradient boosting showed good performance for classifying FWs with and without PPH. ML excels in the simultaneous analysis of multiple predictive variables, considering their combinations and interactions, without relying on pre-assumed relationships between variables.28 Furthermore, ML places a greater emphasis on producing consistent and precise predictions rather than on interpretability. It also continually improves and self-corrects as the dataset grows over time.29
The study’s findings have several clinical and preventive implications. Firstly, the identification of predictive factors can aid healthcare professionals in assessing the risk of PPH in FWs. Individuals with identified risk factors can be closely monitored, and preventive measures, such as posture correction exercises or ergonomic adjustments, can be implemented early to reduce the likelihood of PPH development. Secondly, the superiority of ML models in classification suggests the potential for developing automated screening tools that can quickly and accurately assess PPH risk in FWs. While this study provides valuable insights into PPH classification among FWs, there are opportunities for further research. Future studies could explore additional factors, such as work-related stress, physical activity levels, and ergonomic conditions, to gain a more comprehensive understanding of PPH in this occupational group. Moreover, longitudinal studies tracking the progression of musculoskeletal pain and PPH over time would be beneficial in identifying causal relationships and effective intervention strategies.
We should recognize certain limitations of this study. The sample primarily comprised FWs, which might restrict the applicability of the results to different groups. Also, the study’s cross sectional nature, relying on existing data, might introduce selection bias and confounding variables. Future research in this field could emphasize prospective studies involving more diverse populations and incorporating additional clinical variables. There’s a need for further exploration of the mechanisms that underlie the connection between postural variables and PPH.
CONCLUSION
This study focused on musculoskeletal pain in FWs, particularly in the neck and shoulders, and aimed to classify PPH using ML compared to logistic regression. The research identified that the gradient boosting ML model performed best in classifying PPH, highlighting the importance of factors like scapular downward rotation ratio, forward head posture, BMI, and rounded shoulder angle. While no statistical differences were found in certain postural variables between those with and without PPH, ML models demonstrated their classification power. This research has potential implications for early intervention and risk assessment in PPH among FWs, possibly leading to automated screening tools. This research contributes significantly to the field of occupational health by highlighting the prevalence of musculoskeletal pain among FWs and offering advanced machine learning techniques for the classification of pressure pain hypersensitivity. The identification of significant predictors and the potential for automated screening tools hold promise for improving the well-being of FWs and reducing the burden of musculoskeletal pain in this profession.


